Building a Big Lumen Tube!

Building a Big Lumen Tube#
- Introduction
- Parts
- Tools
- Wiring of the sensors
- Software
- Testing the light sensor
- Testing the temperature sensor
- Steps to build the lumen tube
- Calibrating the lumen tube
- Runtimes
- Graphs
- Conclusion
Introduction#
I decided to build a big lumen tube because the IMALENT MS12 MINI overpowered the light sensor in my small lumen tube by producing over 65,000 lumens on Turbo.
My small lumen tube, with a diameter of 90mm, does a good job of measuring the light output of most torches. The most powerful torch that I had tested, prior to the IMALENT MS12 MINI, was the Nightwatch Chaos NS59v2 where it reached 30,390 lumens on Turbo. The NS59v2 is scary fun! It reached a temperature of 78 C.
I figured that the IMALENT MS12 MINI, with a head diameter of 85mm, would fit my 90mm lumen tube and I would simply record the output of another torch. Worst case? The torch might melt my lumen tube. I put my sunglasses on, started recording, put the torch on the lumen tube, double clicked for Turbo, and the light sensor was instantly overpowered! Doh!
I was faced with three options:
- Build a big lumen tube for measuring powerful torches!
- Put a different neutral density filter in my small lumen tube to reduce the amount of light reaching the sensor.
- Get a large hollow polystyrene ball and build an integrating sphere.
Option 2 is a bit risky. I used a VEML7700 light sensor in the past and I had issues with it not being able to detect less than one lumen or accurately detect more than 1,000 lumens in my small lumen tube. I ended up swapping the sensor for a TSL2591 and redid the runtime tests.
Would my small lumen tube be able to detect less than ten lumens if I put a different neutral density filter in it? I didn’t want to mess around and find out.
By changing the neutral density filter, my small lumen tube would end up with a different “correction factor”. I regularly use a torch with a known lumen output to check the calibration of my small lumen tube. It has remained fairly consistent. If I change the tube, then the “correction factor” will change, and my runtime results may be less comparable. I’ll talk more about calibration and “correction factor” later on.
I would highly recommend using a large hollow polystyrene ball to build an integrating sphere instead of building a lumen tube. It is likely to do a better job at integrating light. I didn’t go with Option 3 because it is difficult to find large hollow polystyrene balls.
I ended up going with Option 1 and I spent a week building a big lumen tube capable of measuring over 65,000 lumens!
Here is a tutorial for building a big lumen tube, with a diameter of 150mm, to measure the light output and the temperature of a torch.
Parts#
- Adafruit TSL2591 light sensor with STEMMA QT.
- Adafruit MCP9601 thermocouple amplifier with STEMMA QT.
- Type K thermocouple.
- SparkFun Qwiic Shim for Raspberry Pi (RPI).
- Raspberry Pi Zero 2 WH (Raspberry Pi 4 or 5 with headers is faster).
- 200mm + 500mm Qwiic/STEMMA qt cables to run from the RPI to amplifier, and then to the light sensor.
- Kenko 52mm PRO1D Pro ND16 neutral density filter.
- Screws for light sensor and thermocouple amplifier.
- 150mm glass lid from a cooking pot.
- 3* 150mm PVC Male-Female 90 degree bend.
- 1* 150mm PVC Threaded Access Coupling.
- 1* 150mm PVC Threaded Access Cap.
- 1* 150mm PVC Cap.
- A small block of wood.
- A large scrap block of wood.
I have selected light and temperature sensors with STEMMA QT connectors to try to reduce the amount of soldering required.
The Adafruit TSL2591 light sensor is for measuring light output (lumens) and the Type K thermocouple with a Adafruit MCP9601 amplifier is for measuring temperature over time.
To avoid overpowering the light sensor, an ND16 neutral density filter has been selected to put in front of the light sensor.
Multiple Male-Female PVC connectors will be connected to create the lumen tube. The cost for PVC goes up significantly as sizes go above 90mm.
Tools#
- PH0 screwdriver.
- Scissors.
- Utility knife.
- Dremmel.
- Ryobi Multi Tool.
- Saw to cut a small block of wood.
- A screw to hold the small block of wood against a threaded PVC cap.
- Drill.
- Drill bits to drill through PVC and wood.
- PH2 screwdriver bit.
- 51mm hole saw.
- Screws to hold a PVC cap against a large block of wood while using a hole saw.
- Small screws to hold a light sensor against a small block of wood.
- Hot glue gun.
- Polyimide tape.
- Black electrical tape.
- Soldering iron.
- Rubber mallet.
- White spray paint.
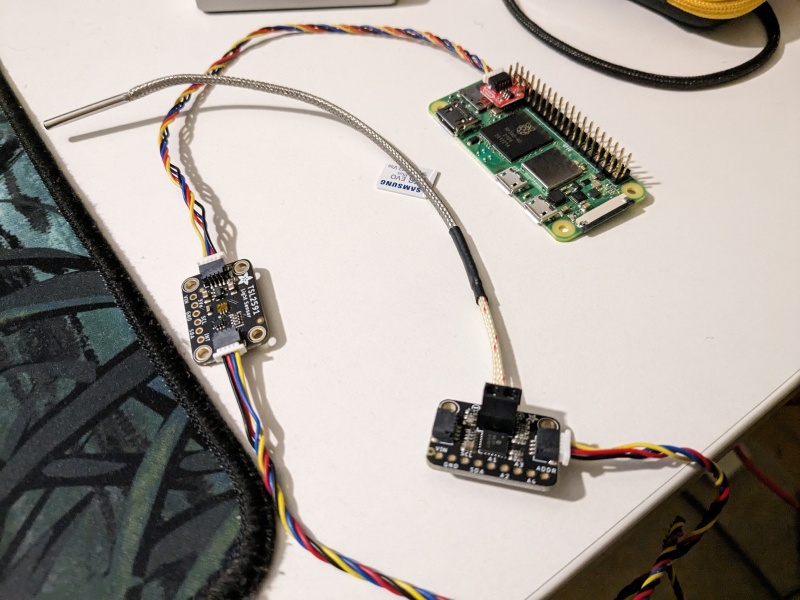
Wiring of the sensors#
Solder a red SparkFun Qwiic Shim to the headers of a Raspberry Pi. You don’t have to solder the shim to the headers but it will make the connection much more reliable.
Solder a 2-pin screw terminal to the Adafruit MCP9601 thermocouple amplifier. Insert two wires of a Type K thermocouple into the 2-pin screw terminal and tighten the screws.
That’s all the soldering! You could avoid soldering if you don’t want to use this temperature sensor.
Connect a 200mm Qwiic cable between the Qwiic shim and the Adafruit TSL2591 light sensor.
Connect a 500mm Qwiic cable between the Adafruit TSL2591 light sensor and the Adafruit MCP9601 thermocouple amplifier.
It should looke something like this:
Software#
Install Ubuntu 22.04 LTS 64-bit on a Raspberry Pi Zero 2.#
The Raspberry Pi Imager can be used to download and install Ubuntu 22.04 LTS 64-bit onto a microSD card.
I tried a 32-bit version but I ran into problems where certain Python libraries (e.g. matplotlib) weren’t compiled for the 32-bit operating system.
64-bit works!
Install some useful utilities in Ubuntu#
sudo apt install git vim python3 python3-dev python3-pip python3-rpi.gpio tmux
git is required to clone RuTiTe from GitHub (you could also use wget or curl).
vim is a text editor.
python3, python3-dev, python3-pip and python3-rpi.gpio may be required for RuTiTe.
I use tmux for running runtime tests that can last hours or days. This allows me to close a terminal and come back to it later.
My .bashrc contains a few aliases:
alias tn='tmux new -s lux'
alias ta='tmux attach -t lux'
screen is an alternative to tmux that you could consider using.
Get RuTiTe for recording runtimes and creating runtime graphs#
RuTiTe is a collection Python scripts by bmengineer for recording runtimes and creating runtime graphs.
I forked RuTiTe and made a few changes (added support for MCP9601, create another script for graphs).
git clone https://github.com/TimMcMahon/RuTiTe
cd RuTiTe
requirements.txt
pip
setuptools
wheel
adafruit-blinka
adafruit-circuitpython-tsl2591
adafruit-circuitpython-veml7700
adafruit-circuitpython-mcp9808
adafruit-circuitpython-mcp9600
matplotlib
pandas
numpy
pip3 install requirements.txt
Fix i2c permissions#
The following error may occur if you run a Python script that tries to access i2c:
PermissionError: [Errno 13] Permission denied: '/dev/i2c-1'
Create an i2c group, give it ownership of /dev/i2c-1, give it rw, and add your user (e.g. pi) to the i2c group:
sudo groupadd i2c
sudo chown :i2c /dev/i2c-1
sudo chmod g+rw /dev/i2c-1
sudo usermod -aG i2c pi
Testing the light sensor#
Create a script called tsl2591_test.py with the following:
# SPDX-FileCopyrightText: 2021 ladyada for Adafruit Industries
# SPDX-License-Identifier: MIT
import time
import board
import adafruit_tsl2591

i2c = board.I2C()  # uses board.SCL and board.SDA

try:
    light_sensor = adafruit_tsl2591.TSL2591(i2c)
    light_sensor.gain = adafruit_tsl2591.GAIN_LOW
    #light_sensor.gain = adafruit_tsl2591.GAIN_HIGH

    while True:
        print("lux:", light_sensor.lux)
        time.sleep(0.5)
except:
    print("No light sensor found!")
Run the command python3 tsl2591_test.py
Example output:
lux: 0.0
The above example was adapted from:
https://learn.adafruit.com/adafruit-tsl2591/python-circuitpython
Testing the temperature sensor#
Create a script called mcp9600_test.py with the following:
# SPDX-FileCopyrightText: 2021 ladyada for Adafruit Industries
# SPDX-License-Identifier: MIT
import time
import board
import busio
import adafruit_mcp9600

i2c = busio.I2C(board.SCL, board.SDA, frequency=100000)

try:
    mcp = adafruit_mcp9600.MCP9600(i2c)

    while True:
        print((mcp.ambient_temperature, mcp.temperature, mcp.delta_temperature))
        tempC = mcp.temperature
        tempF = tempC * 9 / 5 + 32
        print("Temperature: {} C {} F ".format(tempC, tempF))
        time.sleep(1)
except:
    print("No temperature sensor found!")
Run the command python3 mcp9600_test.py
Example output:
(16.0, 16.5, 0.375)
Temperature: 16.5 C 61.7 F
The above example was adapted from:
https://learn.adafruit.com/adafruit-mcp9601/python-circuitpython
Almost ready to build the lumen tube?#
Okay! If those scripts are working then you can start building the lumen tube. If the test scripts are working now, then there will be a better chance that they will work after the electronics have been installed in and on the lumen tube.
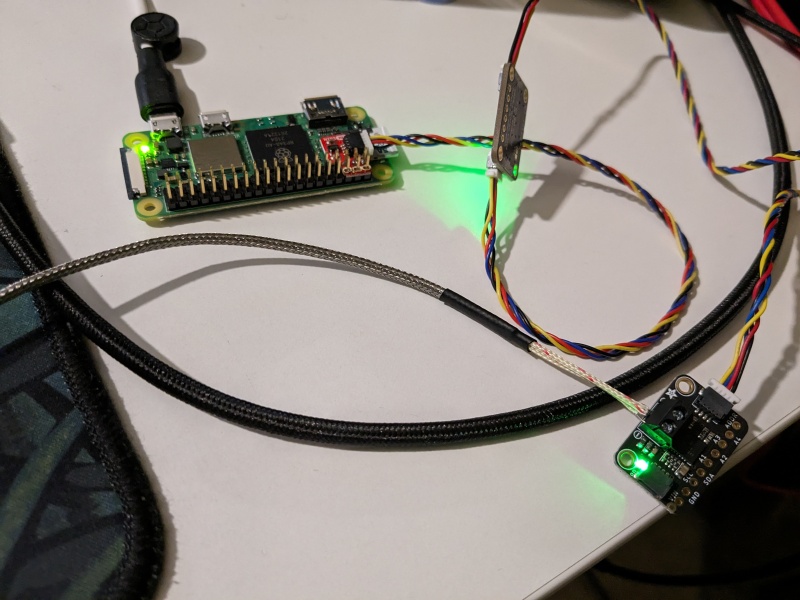
There is a cutable jumper on the back of the Adafruit TSL2591 board that can be cut to disable the green LED.
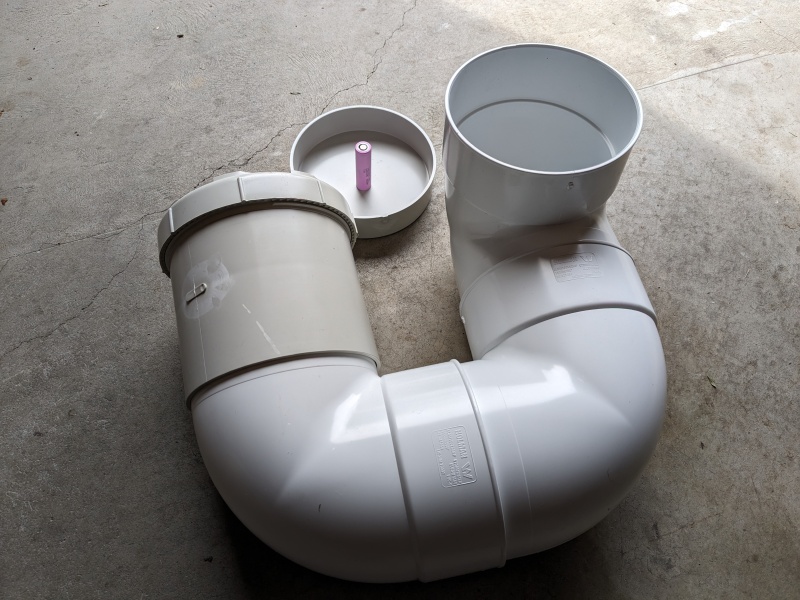
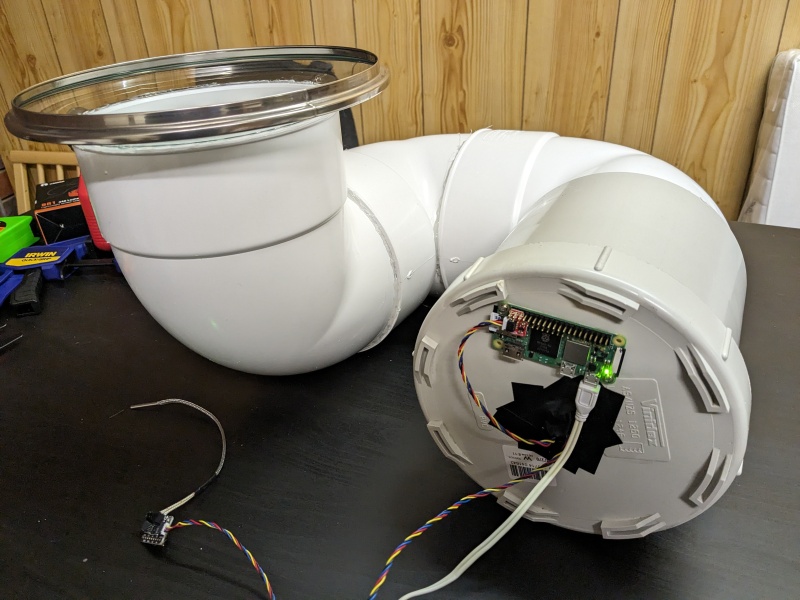
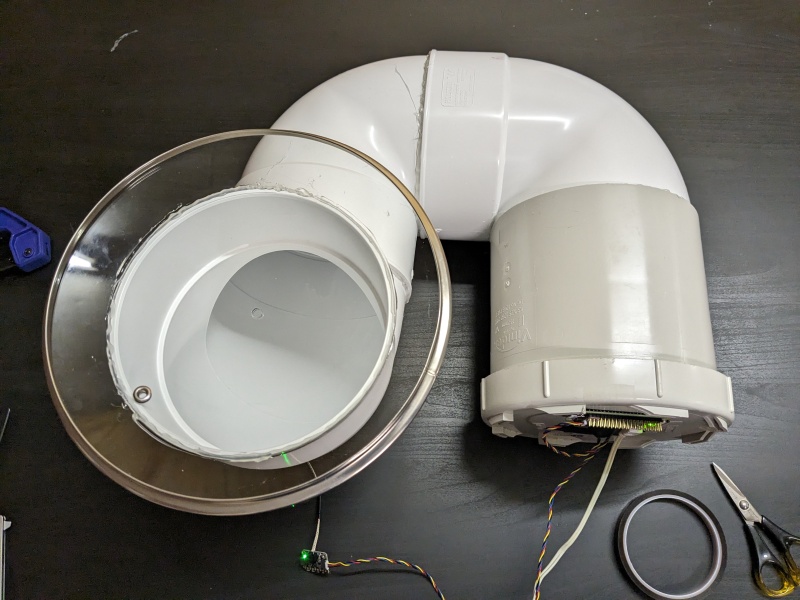
Steps to build the lumen tube#
1. Don’t put all the parts together like this yet. It can be tricky to pull them apart. A rubber mallet comes in handy when removing the parts.
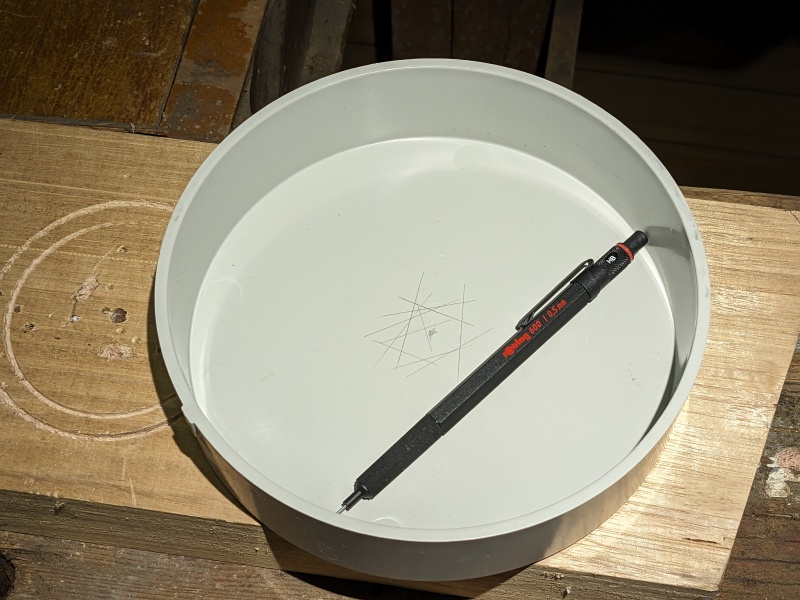
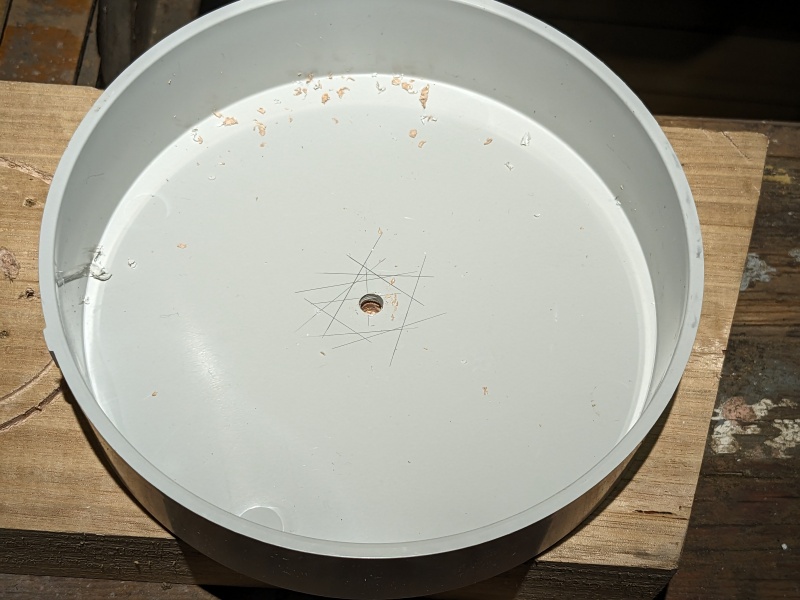
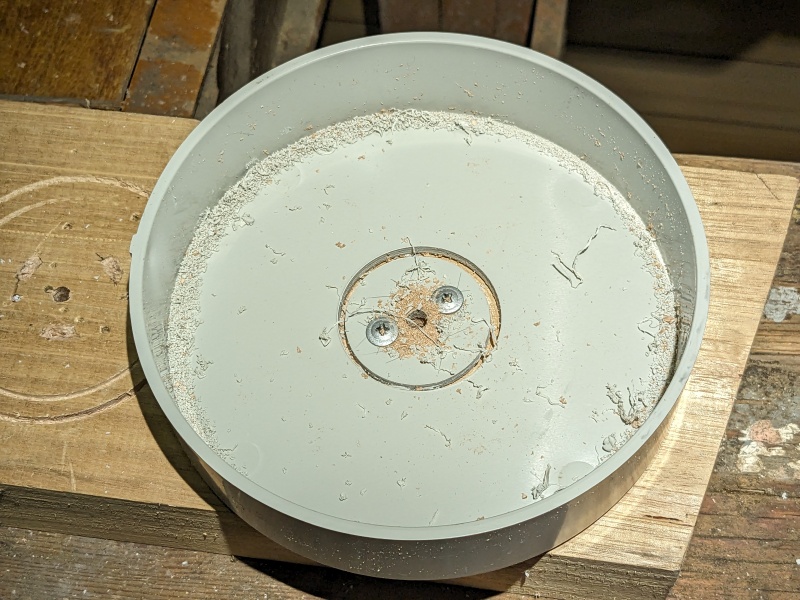
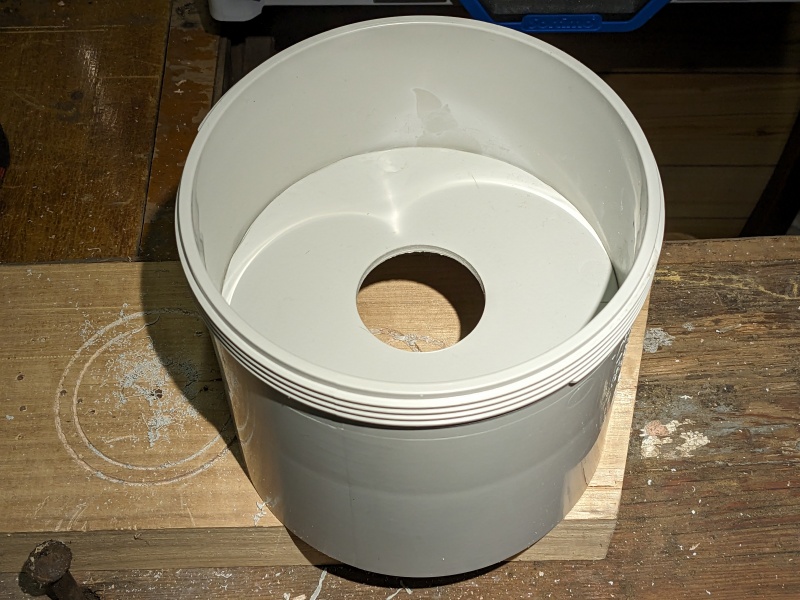
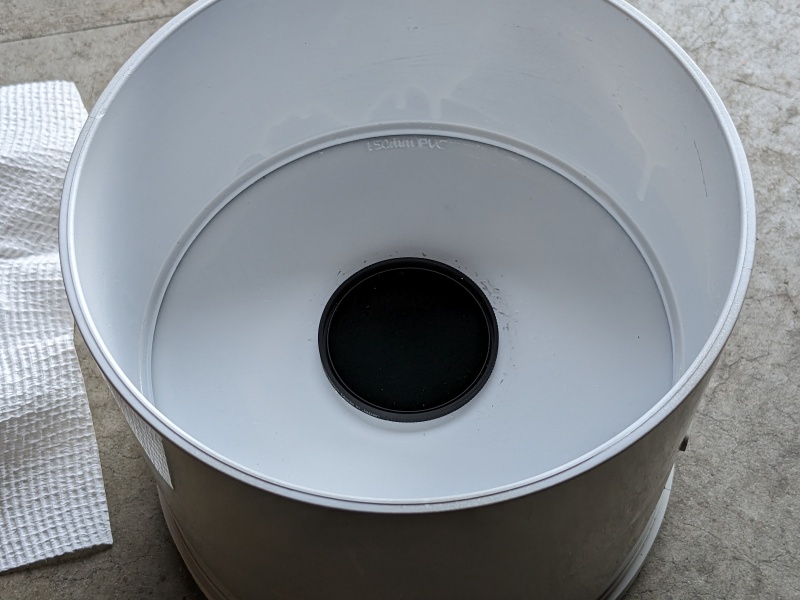
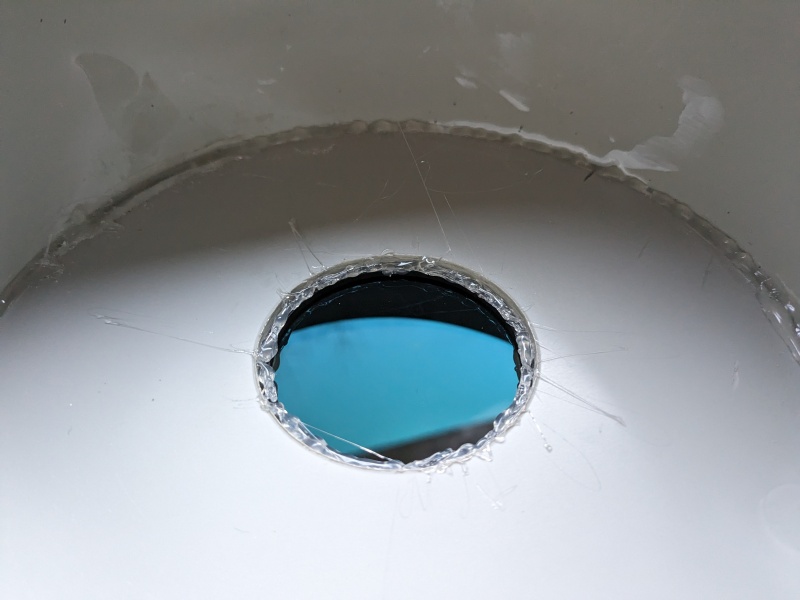
A 51mm hole needs to be made in the centre of a 150mm PVC cap so that a 52mm neutral density filter can be added.
2. Mark the centre of the inside of a 150mm PVC cap using a pencil so that a hole can be drilled through it.
3. Put the 150mm PVC cap on a large scrap block of wood and drill a hole through the middle.
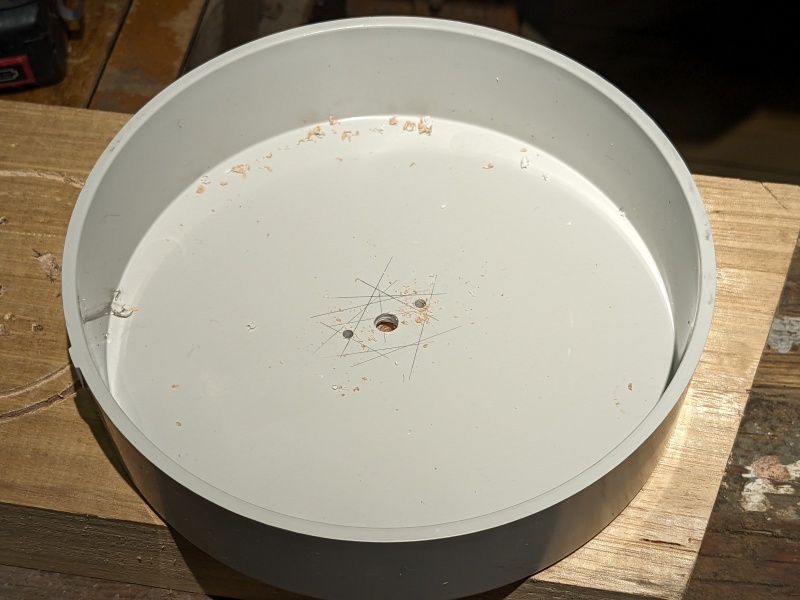
4. Drill two small holes near the hole in the centre. They should be within a 51mm diameter so that two screws can be added without getting in the way of a hole saw.
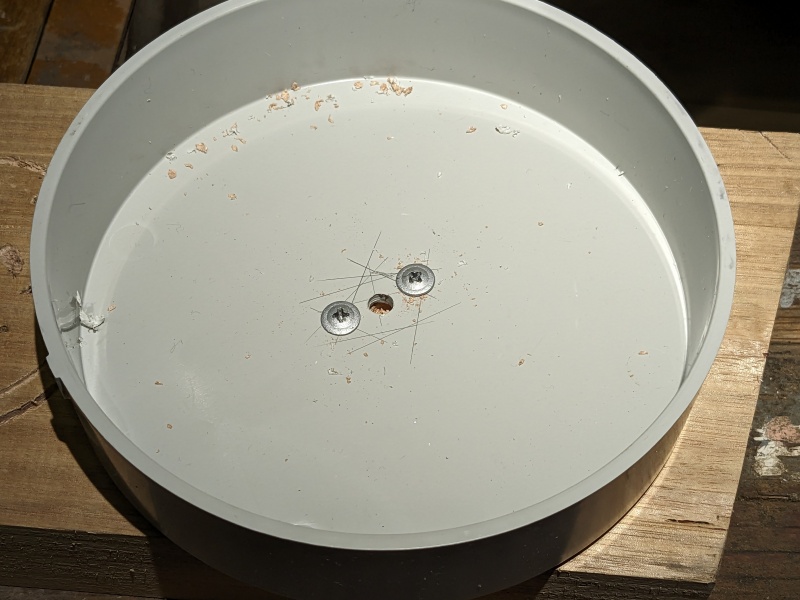
5. Screw two screws into the small holes so that the 150mm PVC cap is secured to the large scrap block of wood.
6. Attach a 51mm hole saw to a drill.
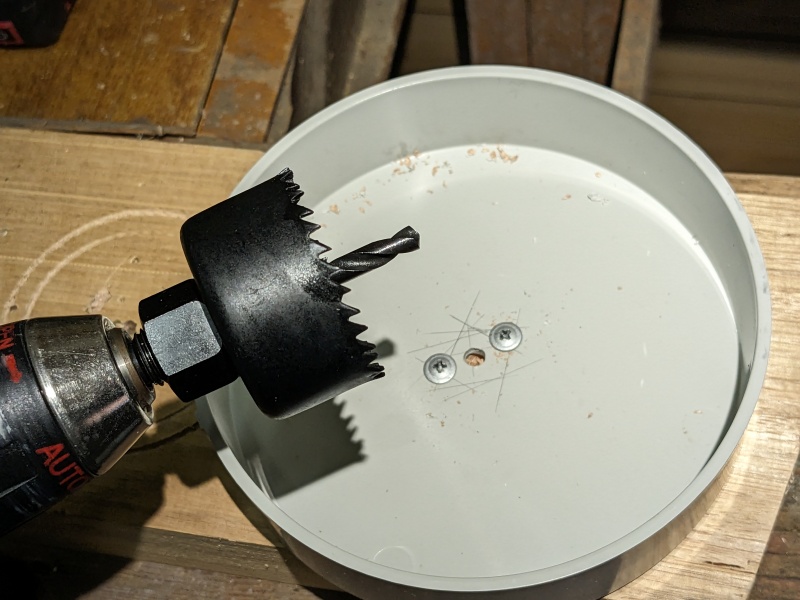
7. Drill a hole into the 150mm PVC cap using a hole saw. The outer part of the 150mm PVC cap might spin around. Be careful!
8. Use a multi-tool or a saw to cut the edges of the 150mm PVC cap.
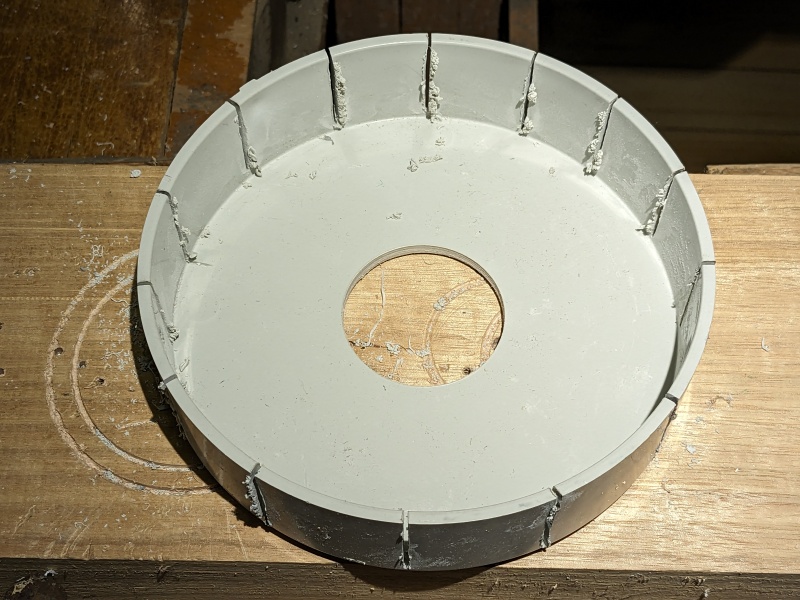
The 150mm PVC cap now needs to be converted into a smaller 150mm disk so that it can be inserted into a 150mm PVC Threaded Access Coupling.
9. Use a utility knife to score the edges. Use a Dremmel to cut the edges down. You may need to go slowly to avoid melting the PVC.
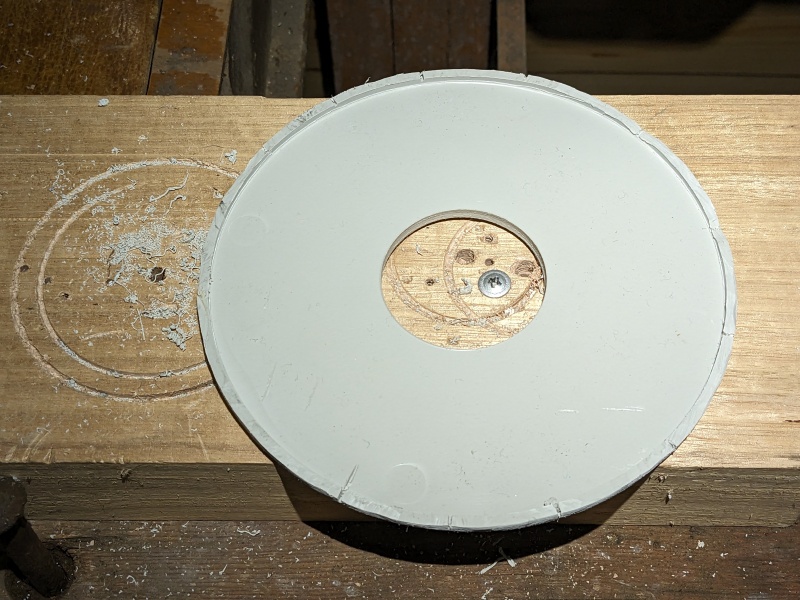
10. Use a Multi Tool with a sanding sheet to make the disk smaller so that it fits inside the 150mm PVC Threaded Access Coupling.
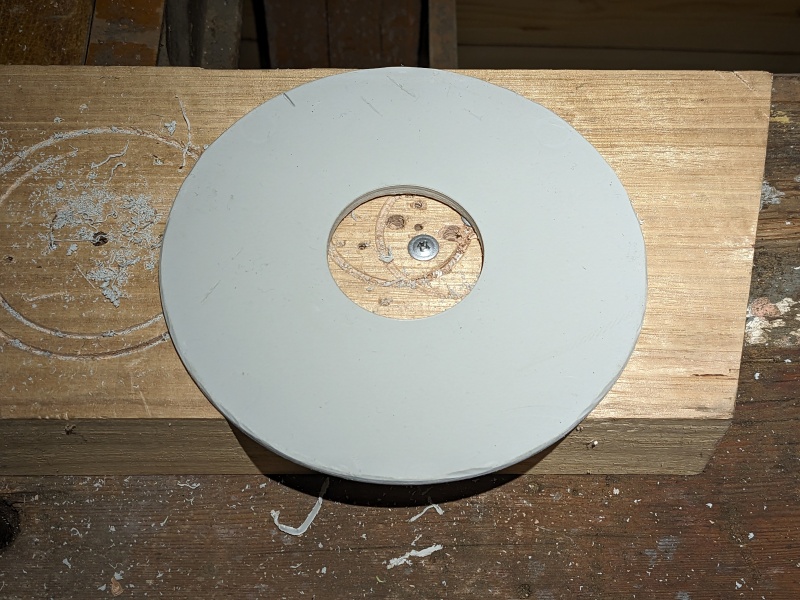
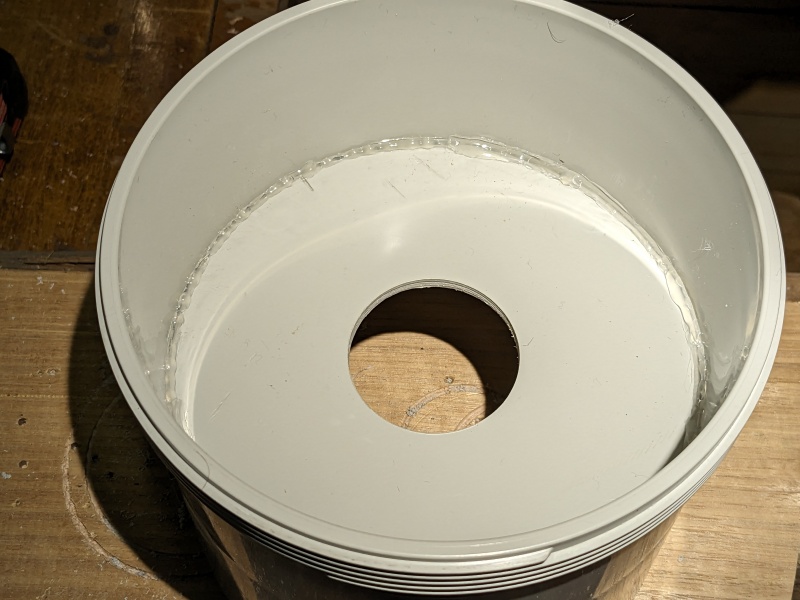
11. Insert the disk into the 150mm PVC Threaded Access Coupling.
12. Add hot glue.
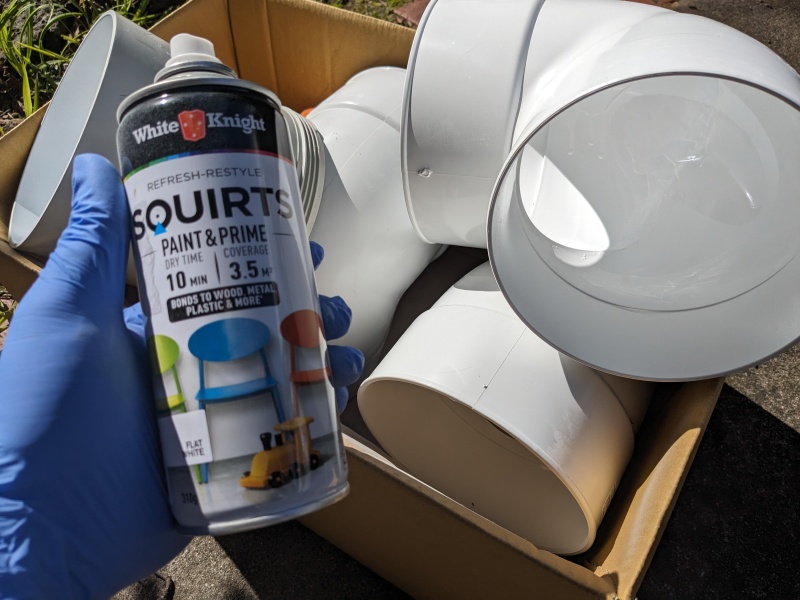
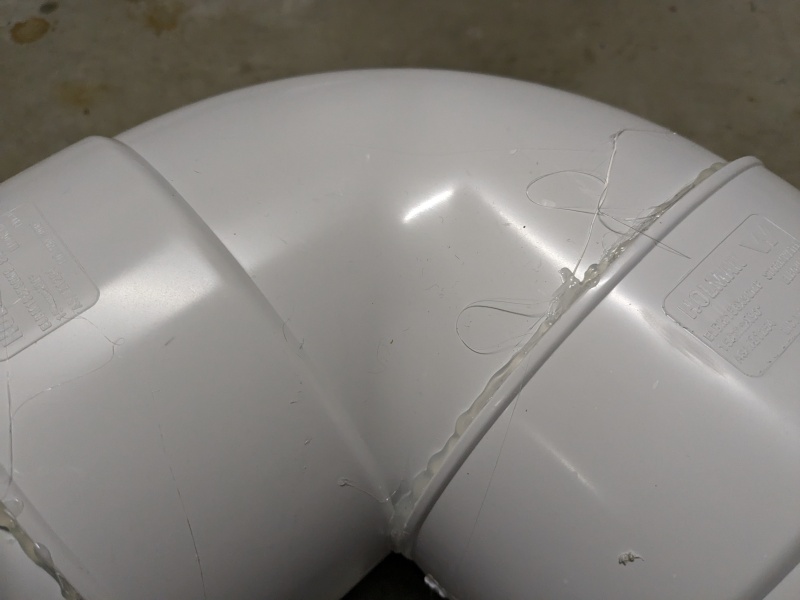
13. Spray the inside of each Male-Female PVC connector with white paint. Spray the inward facing side of the 150mm PVC Threaded Access Coupling with white paint (don’t spray the outward facing part).
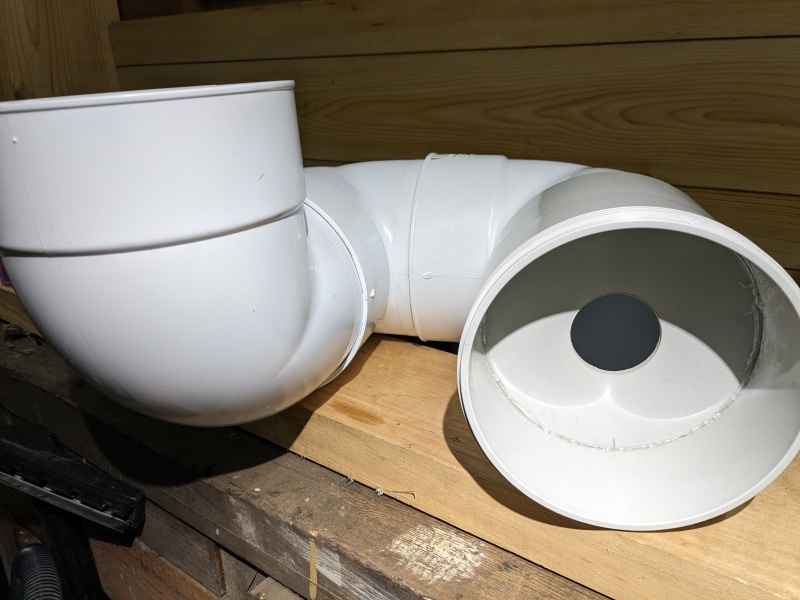
14. Connect the Male-Female PVC parts. Add hot glue. Don’t add the 150mm PVC Threaded Access Coupling yet. A light sensor needs to be added first.
15. Screw the neutral density filter into the 150mm PVC Threaded Access Coupling.
16. Add hot glue to the neutral density filter.
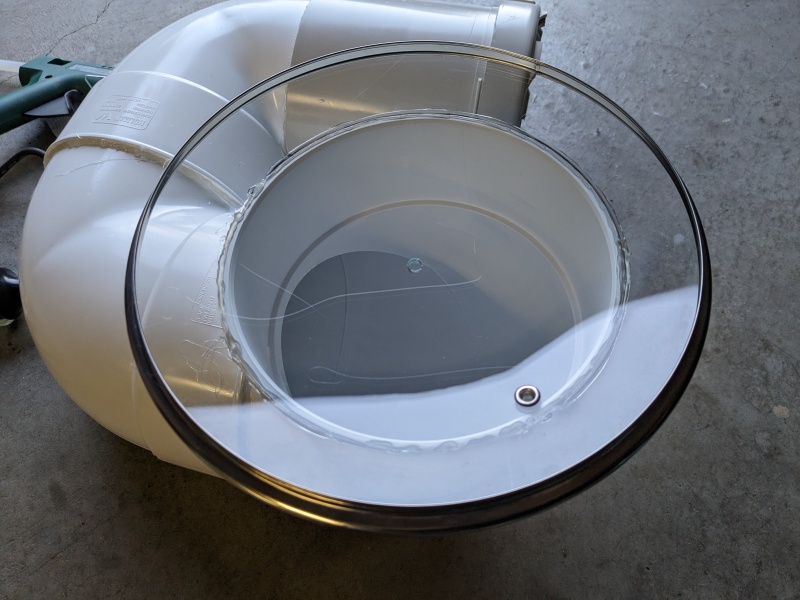
17. Add a glass pot lid to the opening of the PVC tube. Add hot glue.
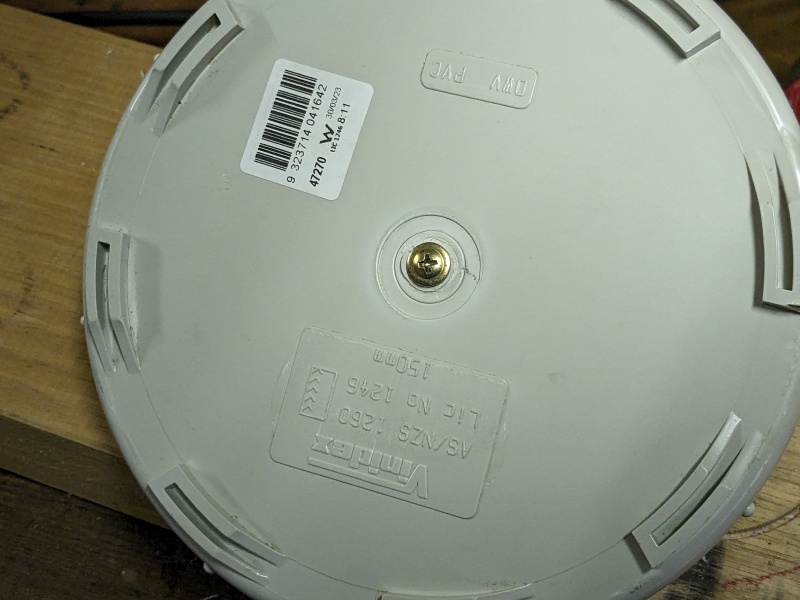
18. Cut and sand a small block of wood to put on the 150mm PVC threaded cap for the 150mm PVC Threaded Access Coupling.
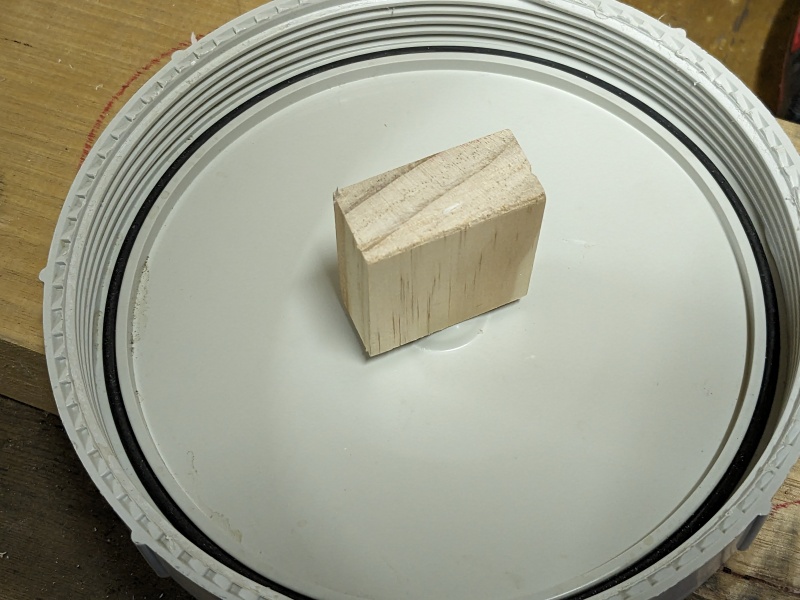
19. Mark the centre of the 150mm PVC threaded cap with a pencil. Drill a thin hole through the cap and the small block of wood. Put a screw through the cap and into the small block of wood to keep the block secure.
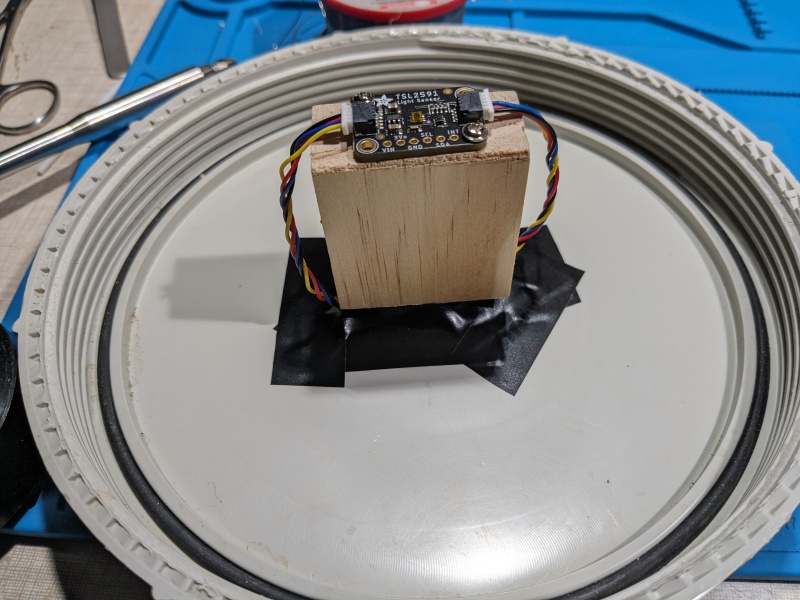
20. Screw the Adafruit TSL2591 light sensor to the small block of wood.
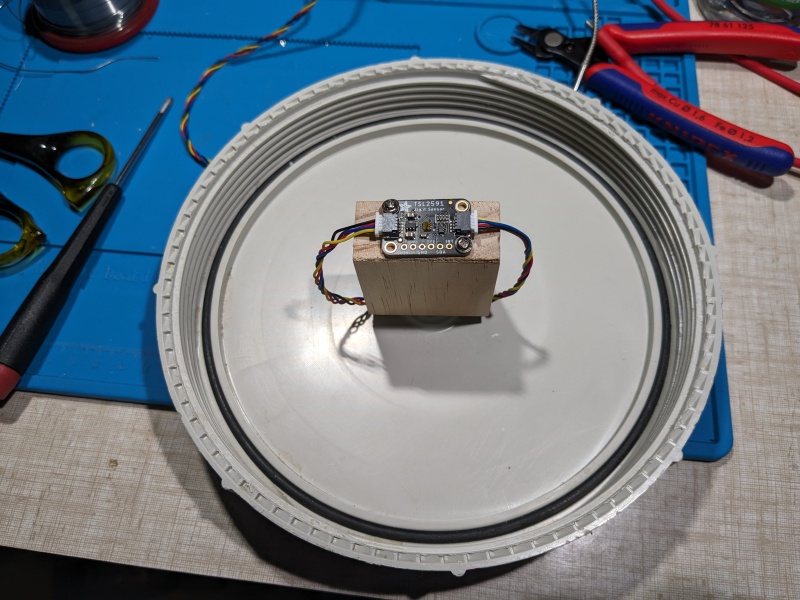
21. Drill two more small holes into the 150mm PVC threaded cap. Put the 200mm and 500mm Qwiic cables through the holes and attach them to the light sensor.
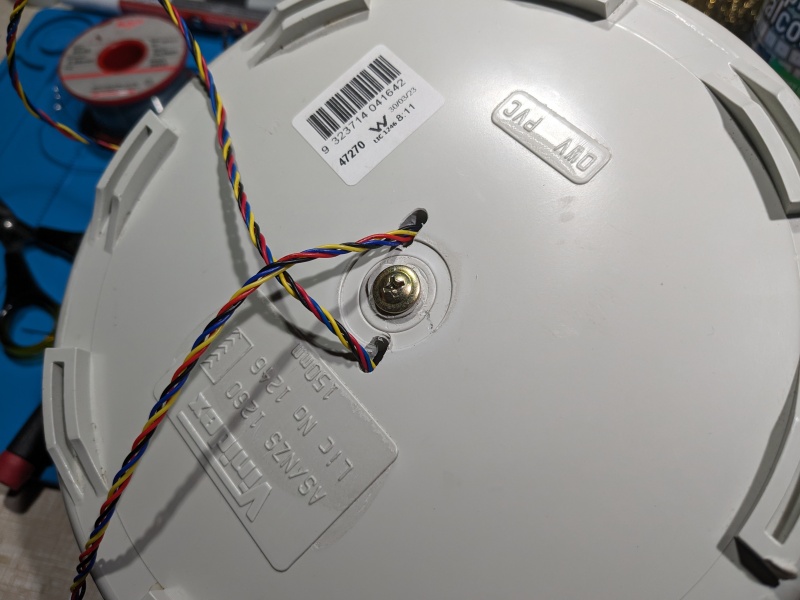
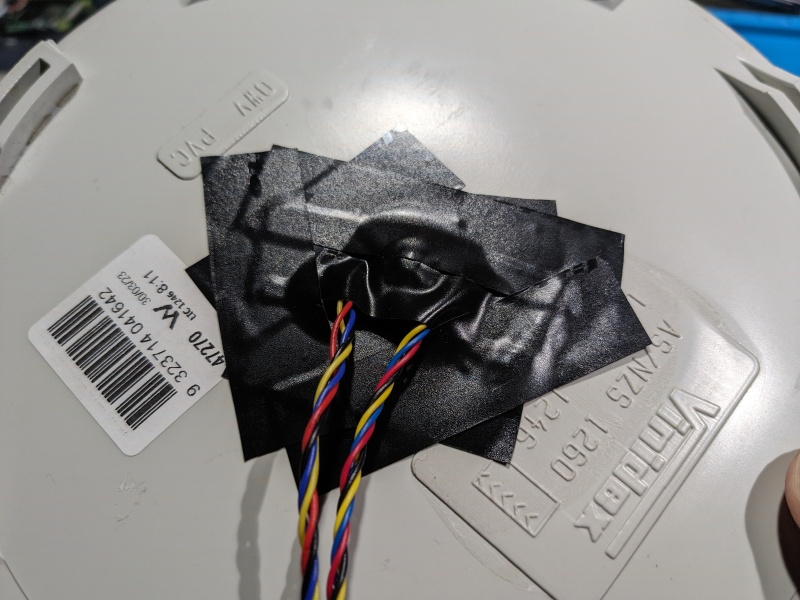
22. Add some black electrical tape to block light from the holes.
23. Add some more tape.
24. Mount the Raspberry Pi to the outside of the lumen tube using some screws. Connect the 200mm Qwiic cable to the Qwiic shim on the Raspberry Pi. Connect the 500mm Qwiic cable to the Adafruit MCP9601 thermocouple amplifier. Connect a power adapter.
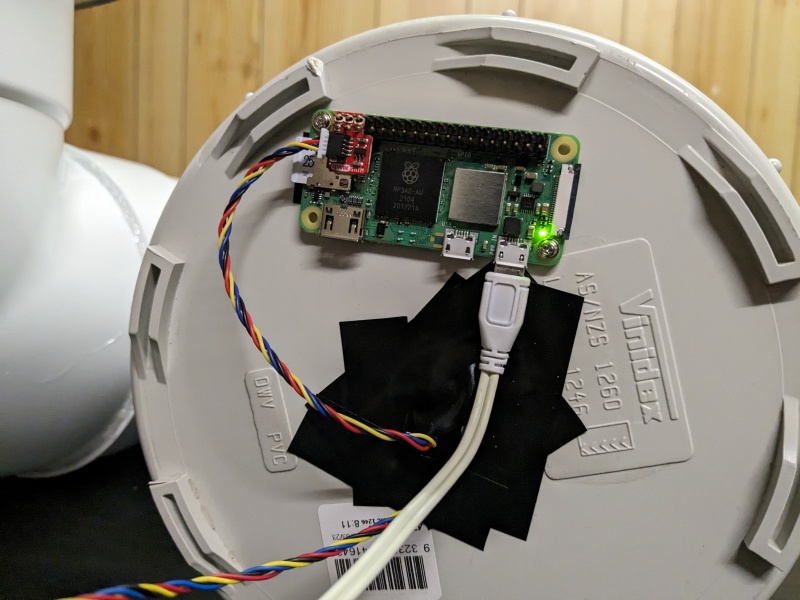
The lumen tube is now ready to be calibrated!
Calibrating the lumen tube#
I bought two calibration lights from maukka on BLF to test my small lumen tube.
To calibrate this lumen tube I decided to measure the output of six different lights:
- Acebeam Pokelit AA Gray
- IMALENT MS12 MINI
- Lumintop Mach
- Maukka calibration light 2110
- Nightwatch Chaos NS59v2
- Wuben X1
I perform all tests in a dark room.
To take measurements I performed the followed steps:
- Put the torch face down on the lumen tube.
- Run RuTiTe.
- Turn the torch on when you see “Ready to start the test”.
- Press CTRL+C to stop the test when you see “Sampling period complete”.
Here is an example where I tested a Wuben X1 on High and I expected 2,391 lumens at 30 seconds:
./rutite.py -ls tsl2591 -o wuben_x1_high_2391.csv
09:01:41 Saving as wuben_x1_high_2391.csv
09:01:41 Ready to start the test. Turn on the light now.
09:01:41 Light detected. Recording started.
09:02:11 Sampling period complete. The output at 30s was 282.8 lux. Sampling period max = 286.9 lux, min = 0.0 lux.
        The test will run until you stop it.
282.8 lux at 30 seconds.
Correction factor: 282.8 / 2391 = 0.118
I took lux measurements for Low, Med, High, Turbo etc at turn on and 30 seconds and put them in a spreadsheet.
I then added columns for different correction factors (0.11, 0.112, 0.113, 0.114, 0.1145, 0.115, 0.118, 0.12, 0.123) so that I could see what the output looked like for each torch with various correction factors.
I compared the results of the IMALENT MS12 MINI with 1lumen.com for a sanity check.
I eventually settled on a correction factor of 0.11.
It isn’t perfect. There is room for improvement (more on that in the conclusion below).
Runtimes#
When I test a particular mode of a torch, I like it when I can turn the torch on and have it instantly go into the desired mode so that energy isn’t wasted on changing modes.
Torches that have shortcuts to Moonlight, Low and Turbo from off, and the ability to memorise a mode after a battery has been disconnected are great for runtime testing!
The IMALENT MS12 MINI is one such torch that resets itself when the battery pack has been disconnected. This isn’t really a problem because I can only use the supplied power adapter to charge the battery pack.
I will try to charge a battery in a built-in charger but if it stops charging at 4.15V then I will use an external charger to charge a Li-ion cell to 4.20V.
You may want to get a digital multimeter to be able to measure the voltage of a battery so that you know that it is full before doing a runtime test.
When running each command below, RuTiTe will ask you to turn on the light.
Here are six commands that I used for recording six modes of the IMALENT MS12 MINI:
python3 rutite.py -r -lf 0.11 -i 0.1 -d 61 -ls tsl2591 -ts mcp9600 -o imalent_ms12_mini_turbo.csv
python3 rutite.py -r -lf 0.11 -i 0.1 -d 61 -ls tsl2591 -ts mcp9600 -o imalent_ms12_mini_high.csv
python3 rutite.py -r -lf 0.11 -i 0.1 -d 61 -ls tsl2591 -ts mcp9600 -o imalent_ms12_mini_middle_2.csv
python3 rutite.py -r -lf 0.11 -i 0.1 -d 121 -ls tsl2591 -ts mcp9600 -o imalent_ms12_mini_middle_1.csv
python3 rutite.py -r -lf 0.11 -i 0.1 -d 211 -ls tsl2591 -ts mcp9600 -o imalent_ms12_mini_middle_low.csv
python3 rutite.py -r -lf 0.11 -i 0.1 -d 301 -ls tsl2591 -ts mcp9600 -o imalent_ms12_mini_low.csv
-lf is the “lux to lumen conversion factor” (or correction factor) that was determine by calibrating the lumen tube. The CSV will contain
-i 0.1 tells the script to take a measurement every 0.1 seconds.
-d 61 is the maximum duration in minutes. Recording will stop at that point. If a mode might last 60 minutes then I will give myself 61 minutes so that there is a bit of time to turn the torch on in the correct mode. If I don’t know how long something will run for then I mght use a value like 721 (12 hours and 1 minute) and stop the recording manually with CTRL+C when the torch turns off. You could use some other parameters to automatically stop the recording (e.g. reach 0%).
-ls tell the script what light sensor to use (TSL2591).
-ts tells the script what temperature sensor to use (MCP9600).
-o sets the filename to save the results to.
It is best not to open the CSV, or to run any other scripts that interact with the sensors while you are recording or it could interfere with the runtime results. Similarly, I wouldn’t recommend transferring large files or doing anything that requires a lot of CPU as this could create gaps in the measurements being recorded (you might miss 5 seconds of measurements). I found out the hard way and redid some runtime tests.
Here is what a CSV looks like:
Time,Lux,[relative time],Duration,Lumens,Temperature (C)
1694085063.7051156,0.0,0.10248780250549316,1.1862014178876523e-06,0.0,22.5625
1694085063.8091462,0.0,0.20651841163635254,2.3902593939392653e-06,0.0,22.5625
1694085063.9132166,0.0,0.3105888366699219,3.59477820219817e-06,0.0,22.5625
1694085064.0174127,0.0,0.41478490829467773,4.800751253410622e-06,0.0,22.5625
1694085064.121354,0.0,0.5187263488769531,6.003777186075847e-06,0.0,22.5625
1694085064.225144,0.0,0.6225161552429199,7.205048093089351e-06,0.0,22.5625
1694085064.3291066,0.0,0.7264788150787354,8.408319618966845e-06,0.0,22.5625
1694085064.4331594,0.0,0.8305315971374512,9.612634226127907e-06,0.0,22.5625
1694085064.5373547,0.0,0.9347269535064697,1.0818598998917474e-05,0.0,22.5625
1694085064.6415913,0.0,1.0389635562896729,1.2025041160760102e-05,0.0,22.5625
1694085064.7455573,0.0,1.1429295539855957,1.3228351319277727e-05,0.0,22.5625
1694085064.8495016,0.0,1.2468738555908203,1.4431410365634494e-05,0.0,22.5625
1694085064.9535081,0.0,1.3508803844451904,1.5635189634782295e-05,0.0,22.5625
1694085065.0572467,0.0,1.4546189308166504,1.6835867254822343e-05,0.0,22.5625
1694085065.1611984,0.0,1.5585706233978271,1.8039011844882257e-05,0.0,22.5625
1694085065.2651575,0.0,1.662529706954956,1.9242241978645325e-05,0.0,22.5625
1694085065.369293,0.0,1.7666652202606201,2.0447514123386807e-05,0.0,22.5625
1694085065.4735062,0.0,1.8708784580230713,2.165368585674851e-05,0.0,22.5625
1694085065.5776055,0.0,1.974977731704712,2.285853856139713e-05,0.0,22.5625
1694085065.6817555,0.0,2.079127788543701,2.4063979034070614e-05,0.0,22.5625
1694085065.7858918,0.0,2.1832640171051025,2.526925945723498e-05,0.0,22.5625
1694085065.8902338,4213.660800000001,2.2876060009002686,2.6476921306716073e-05,38306.00727272728,22.5625
1694085065.9945204,7267.1328,2.391892671585083,2.7683942958160684e-05,66064.84363636364,22.5625
You may want to delete a bunch of lines near the start of the CSV where the Lux value is 0.0 before creating graphs or you will end up with graphs that show how long you took to turn the torch on.
To produce a table of lumen measurements, I will:
- Delete lines near the start of a CSV with a Lux value of 0.0
- Delete a line where the light output recorded appears to be from where I had just pressed the button twice and the emitters were turning on (e.g. 38306 above). If the light takes a while to ramp up then I won’t delete that line and instead I’ll leave it in there so that you can see the output gradually increase over multiple seconds.
- I take the first line remaining and get the “Lumens @turn on”: 66,064
1694085065.9945204,7267.1328,2.391892671585083,2.7683942958160684e-05,66064.84363636364,22.5625 - I make a note of the relative time for the first record, 2.39 seconds.
- I scroll down to approximately 32.39 seconds to get “Lumens @30 sec”: 43,650
1694085095.9863772,4801.507200000001,32.38374948501587,0.00037481191533583183,43650.06545454546,36.5 - I calculate 10% of 43,650: 4,365 and search for when the Lumens drops below this value. That is the end of the runtime according to ANSI/PLATO FL1.
- I scroll down to approximately 602.39 seconds to get “Lumens @10 min”: 10,075
1694085665.9480338,1108.2912,602.3454060554504,0.00697159034786401,10075.374545454544,40.3125
Here is an example of a table of lumen measurements:
| Mode | Specs | Lumens @turn on | Lumens @30 sec | Lumens @10 min |
|---|---|---|---|---|
| Low | 1,500 | 2,173 | 2,025 | 1,937 |
| Middle Low | 3,000 | 3,453 | 3,366 | 3,241 |
| Middle 1 | 5,000 | 4,235 | 4,087 | 3,999 |
| Middle 2 | 13,000 | 10,597 | 10,324 | 9,889 |
| High | 25,000 + 13,000 | 24,638 | 23,806 | 9,964 |
| Turbo | 65,000 + 13,000 | 66,064 | 43,650 | 10,075 |
Graphs#
I copy CSV files across to another Linux machine and then I create the graphs there. A Raspberry Pi Zero 2 can be pretty slow. I prefer to just use it for recording measurements from a light sensor.
Create a graph for a particular mode#
Here is an example of a command for creating a graph of a Turbo mode of a torch:
python3 runtime_plot.py -lf 0.11 -ts mcp9600 -in imalent_ms12_mini_turbo.csv -wx 0.09 -wy 0.17 -g 'IMALENT MS12 MINI - Turbo' -dmax 3600 -dmajor 600 -dminor 300 -glmax 70000 -ls 5000 -gtmin 14 -gtmax 62 -wa "timmcmahon.com.au" -wi 900 -hi 900
-in is for specifying the name of the CSV file to read.
-dmax is the maximum duration in seconds of the graph. It could be set to whatever you want. If Turbo lasts less than 60 minutes then you could set the dmax to 60 minutes (or a lower value). But remember, it’s in seconds, so it needs to be set to 3600 for 60 minutes.
-dmajor and -dminor are the lines on the graph along the horizontal x-axis. Pick appropriate values. I would select 600 and 300 but these values may need to be increased if you make the height and width of the graph bigger.
-ts mcp9600 tells the script that a temperature sensor was used and that it should plot the temperature on the graph.
-gtmin and -gtmax are the minimum and maximum temperature values along the second y-axis near the right of the graph.
-glmax is the maximum lumens for the y-axis. I set it to 70000 because the torch reached about 66,000 lumens.
-ls is the number of lumens between each major line along the y-axis. I set it to 5000 because this particular torch is powerful. I would normally set this to about 100.
-w is a text watermark. -wx and -wy change where the watermark is displayed on the graph.
-wi is the width in pixels. I set it to 900 pixels.
-hi is the height in pixels. I set it to 900 pixels.
This is what the graph looks like:
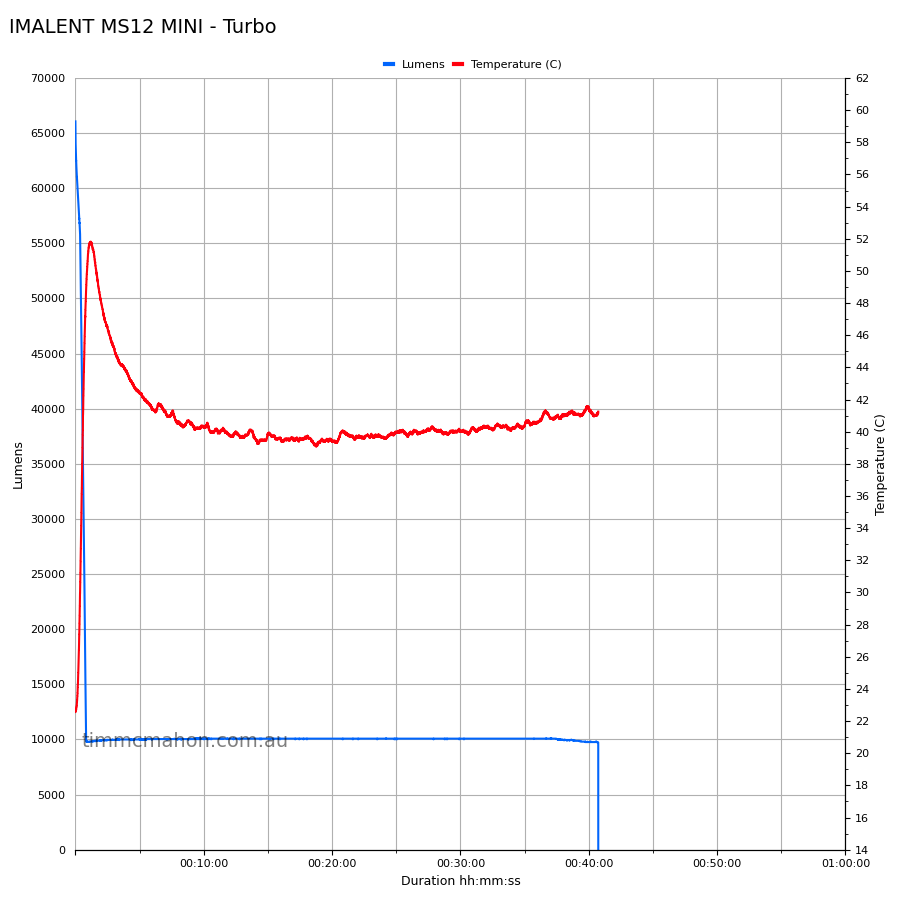
Please note: The temperature in the above graph is not very accurate because the thermocouple wasn’t attached securely. I measured almost 70 C with an infrared thermometer.
Create multiple graphs for all modes#
There are a few things that need to be configured in the multi_runtime_plot.py script before running the script:
- Set the CSV_COUNT to the number of CSVs that are going to be used for the graph.
- Set the values for FILE_1, FILE_2, FILE_3 etc by starting with the CSV with the shortest runtime.
- Set the values for LABEL_1, LABEL_2, LABEL_3 etc so that the graph displays pretty names.
For example:
CSV_COUNT = 6
FILE_1 = 'imalent_ms12_mini_turbo.csv'
FILE_2 = 'imalent_ms12_mini_high.csv'
FILE_3 = 'imalent_ms12_mini_middle_2.csv'
FILE_4 = 'imalent_ms12_mini_middle_1.csv'
FILE_5 = 'imalent_ms12_mini_middle_low.csv'
FILE_6 = 'imalent_ms12_mini_low.csv'
LABEL_1 = 'Turbo'
LABEL_2 = 'High'
LABEL_3 = 'Middle 2'
LABEL_4 = 'Middle 1'
LABEL_5 = 'Middle Low'
LABEL_6 = 'Low'
The script assumes that FILE_1 has a longer runtime than FILE_2, and FILE_2 is longer than FILE_3 and so on. If this is not the case (e.g. Turbo lasts 2 hours and High lasts 1 hour, while Medium lasts 3 hours) then you may want to reorder the CSVs or change some of the code.
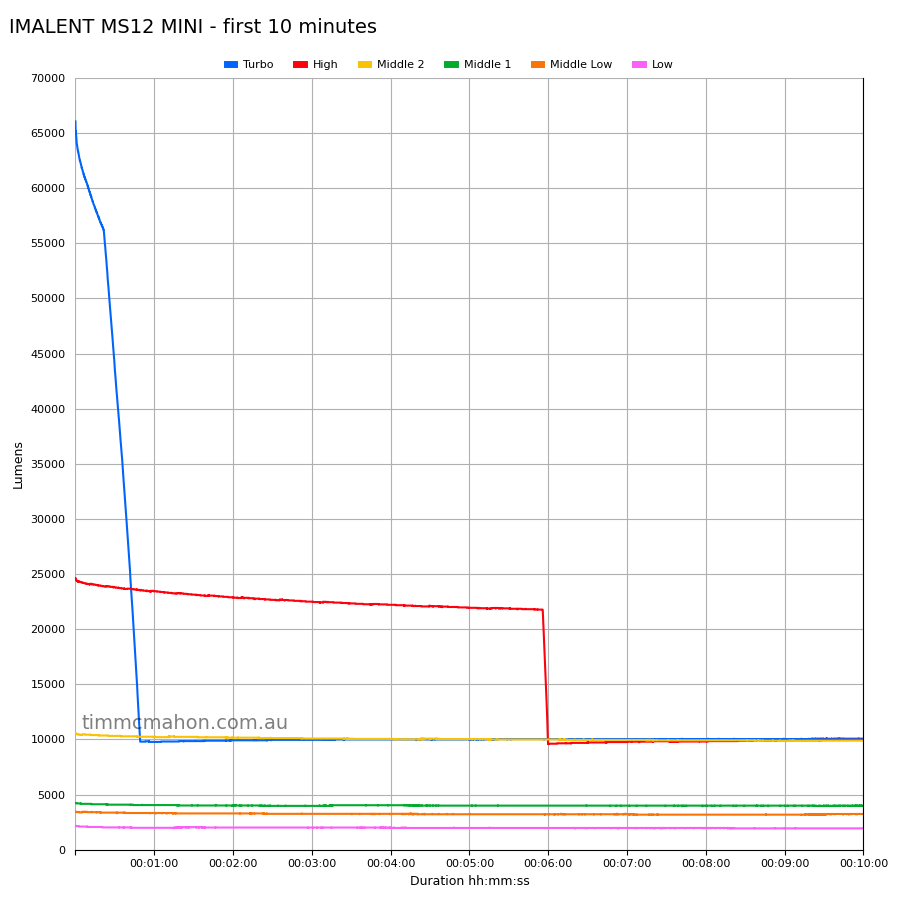
First 10 minutes#
Here is an example of a command for creating a graph that shows the first 10 minutes of each runtime:
python3 multi_runtime_plot.py -lf 0.11 -wx 0.09 -wy 0.19 -g 'IMALENT MS12 MINI - first 10 minutes' -dmax 600 -dmajor 60 -dminor 60 -glmax 70000 -ls 5000 -wa "timmcmahon.com.au" -wi 900 -hi 900
Note that I have not included the -ts parameter for a temperature sensor.
dmax is set to 600 seconds (10 minutes).
dmajor and dminor are set to appropriate values.
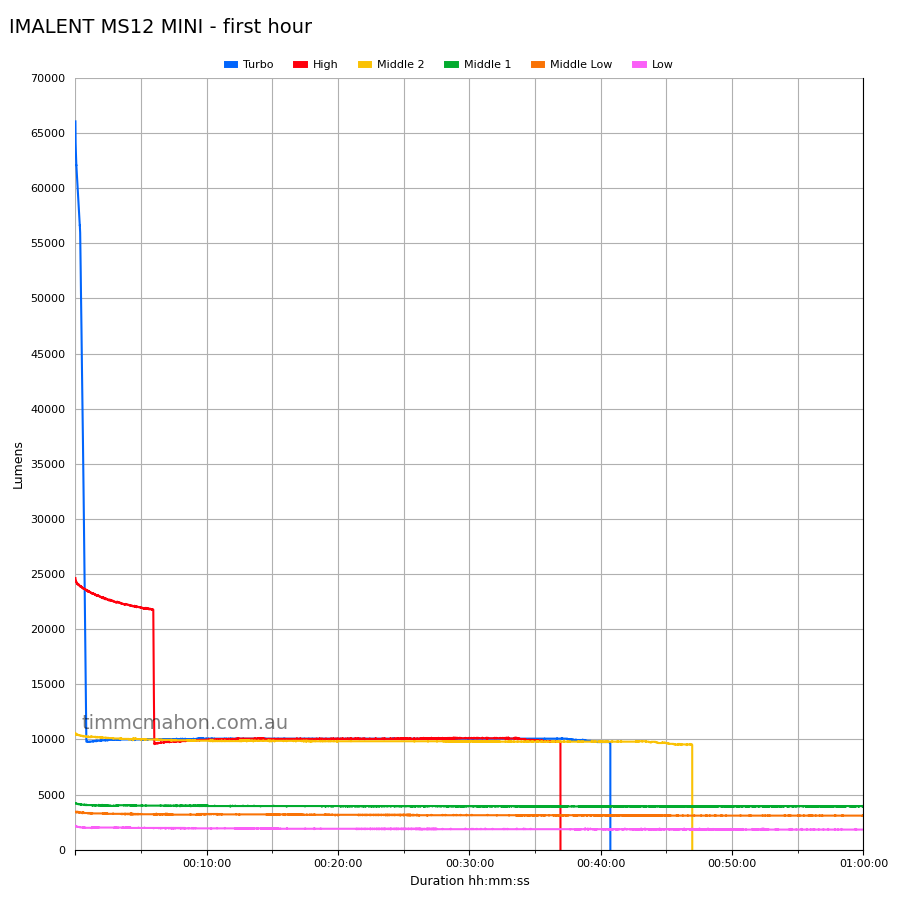
First hour#
At this point, I normally lower the value of CSV_COUNT in the multi_runtime_plot.py so that I don’t create a graph that includes 10 minute runtimes. It looks a bit odd. If Low is going to last 2 weeks then I will only test it for 10 minutes. If Low is going to last 2 days, and I am interested in seeing if that’s true, then I might record the runtime for 48 hours.
Here is an example of a command for creating a graph that shows the first hour of each runtime:
python3 multi_runtime_plot.py -lf 0.11 -wx 0.09 -wy 0.19 -g 'IMALENT MS12 MINI - first hour' -dmax 3600 -dmajor 600 -dminor 300 -glmax 70000 -ls 5000 -wa "timmcmahon.com.au" -wi 900 -hi 900
Full runtime#
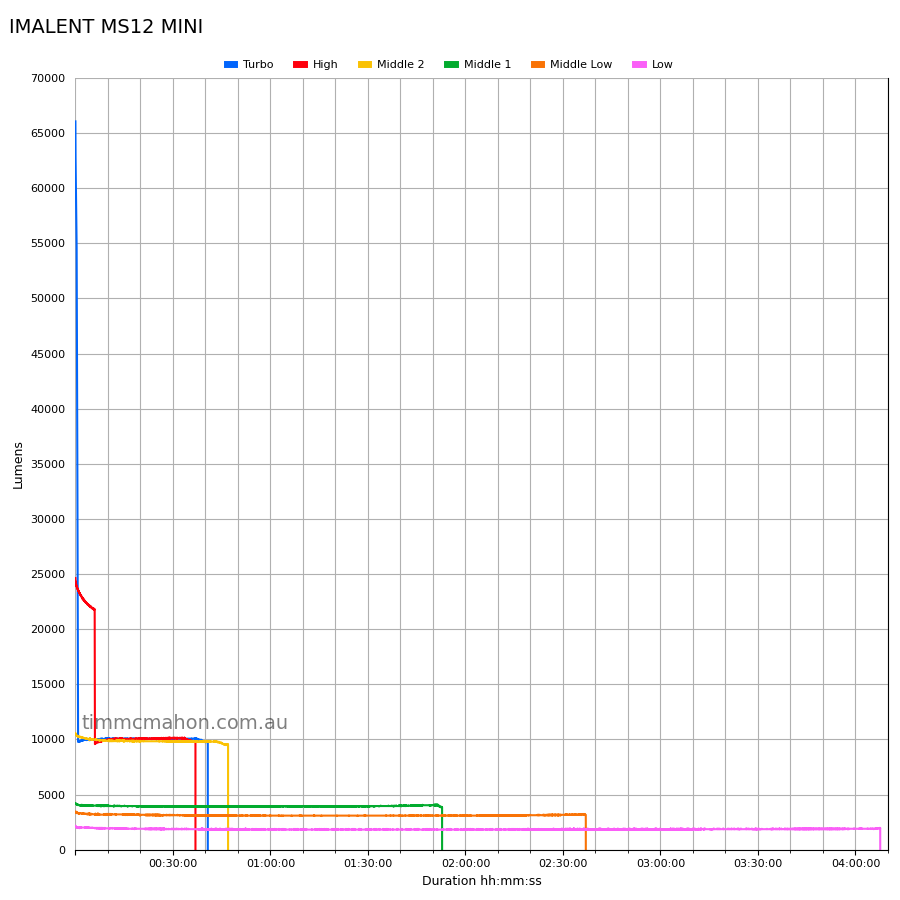
Here is an example of a command for creating a graph of each runtime:
python3 multi_runtime_plot.py -lf 0.11 -wx 0.09 -wy 0.19 -g 'IMALENT MS12 MINI' -dmax 15000 -dmajor 1800 -dminor 600 -glmax 70000 -ls 5000 -wa "timmcmahon.com.au" -wi 900 -hi 900
Conclusion#
I am happy with the performance of my 150mm lumen tube when measuring light output above 1,000 lumens but I need to experiment with adding diffusing sheets to improve the accuracy between 1 and 1,000 lumens.
Fortunately, the IMALENT MS12 MINI’s lowest mode is around 2,000 lumens and it switches off when the voltage is low rather than reduce the light output.
I’ll continue to use my 90mm lumen tube for torches that produce less than 31,000 lumens.
I hope that this gives you some insight into how I perform runtime tests and generate graphs. There is room for improvement. What would you improve?